


Century 21 People’s Choice Realty Inc., Brokerage
120 MATHESON BLVD E #103
MISSISSAUGA, Ontario
L4K 0A4


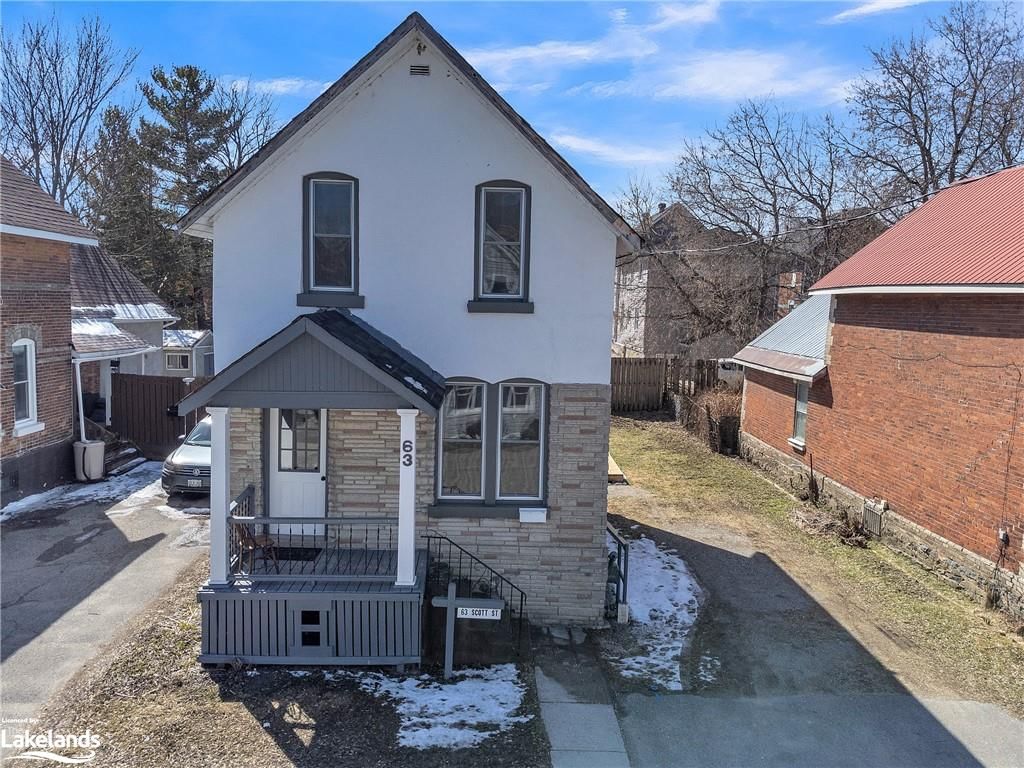
Orillia, North Ward, L3V 7M2
$674,500$000000
Listed by RE/MAX Hallmark Chay Realty Brokerage.
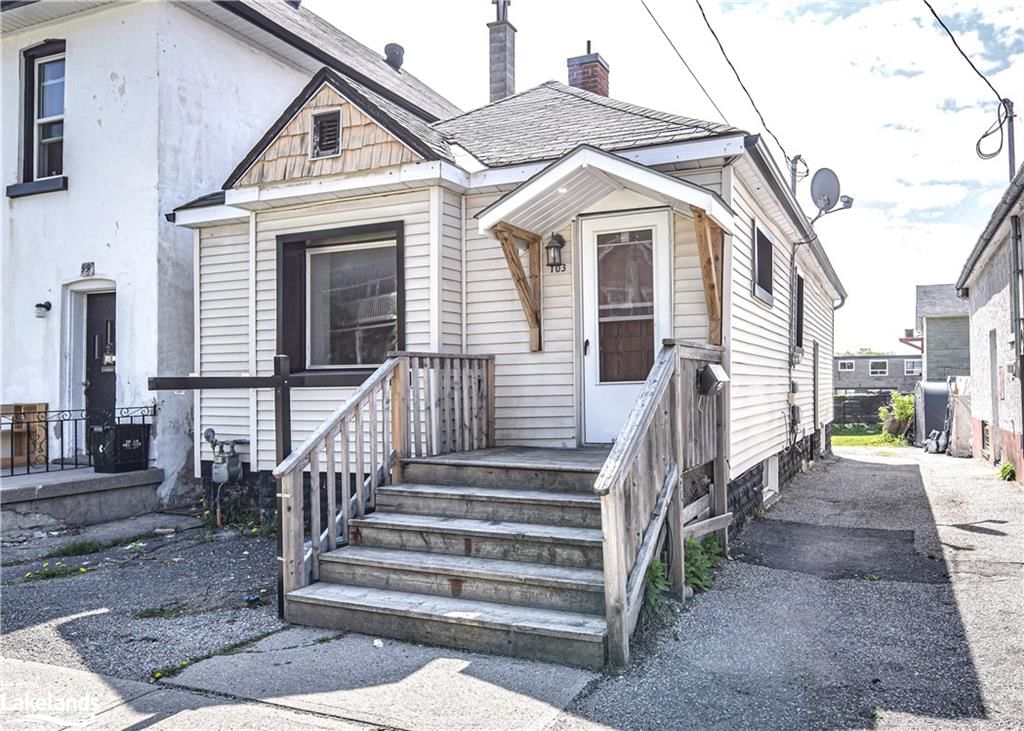
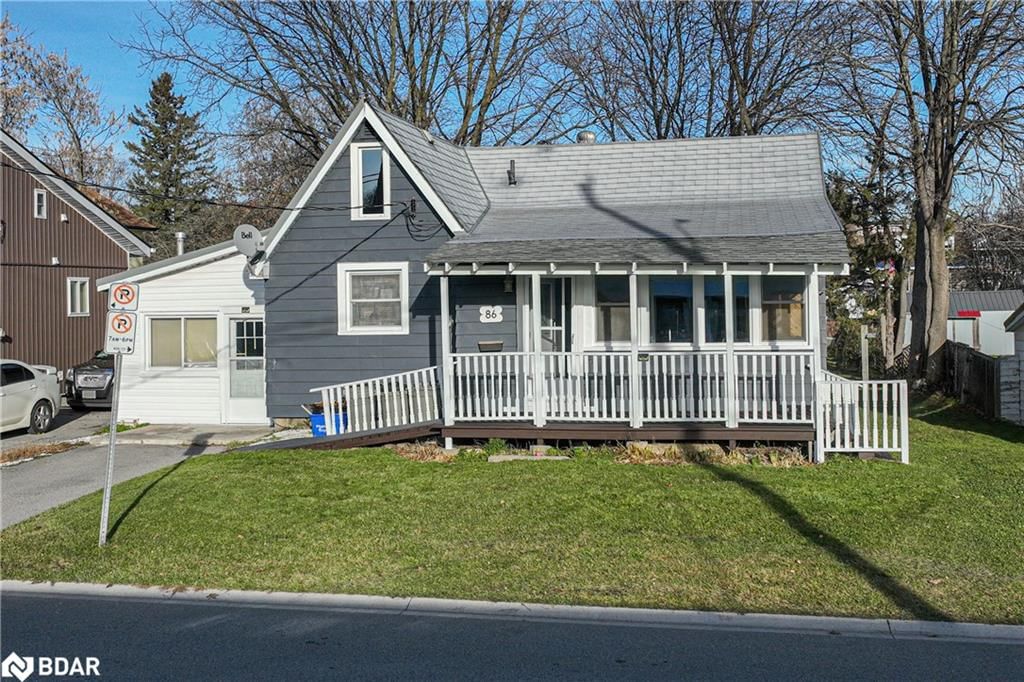
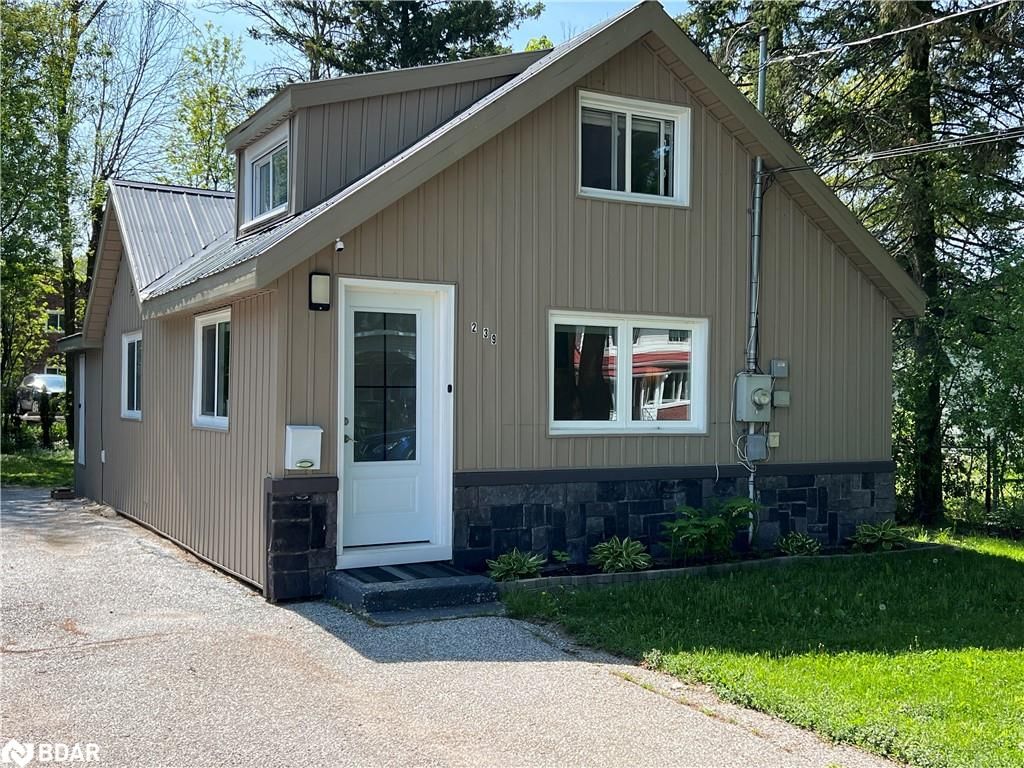
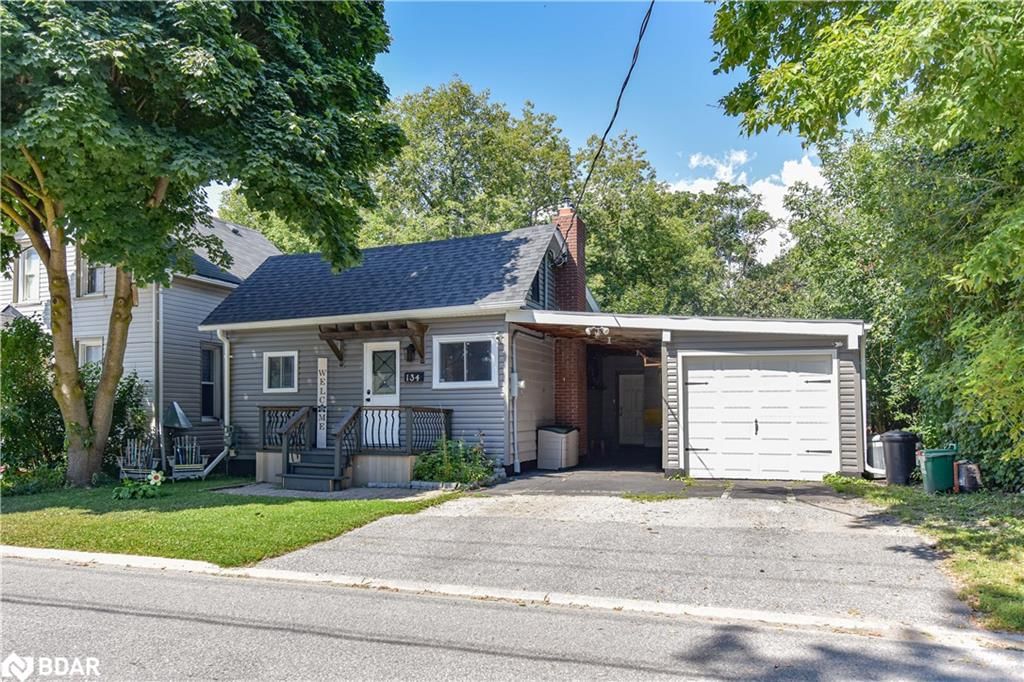
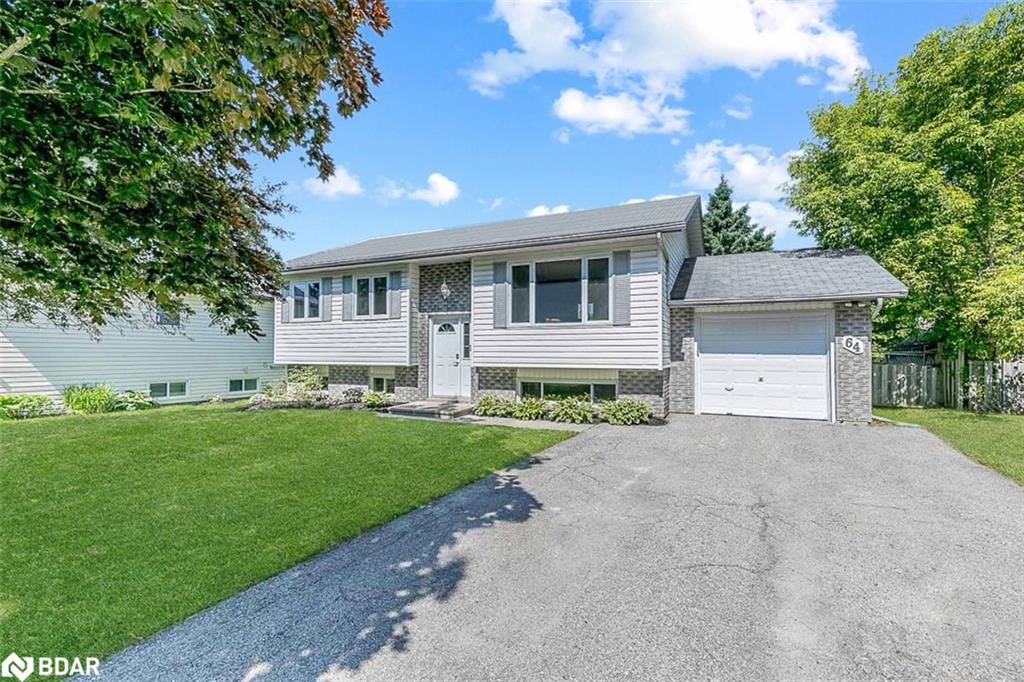
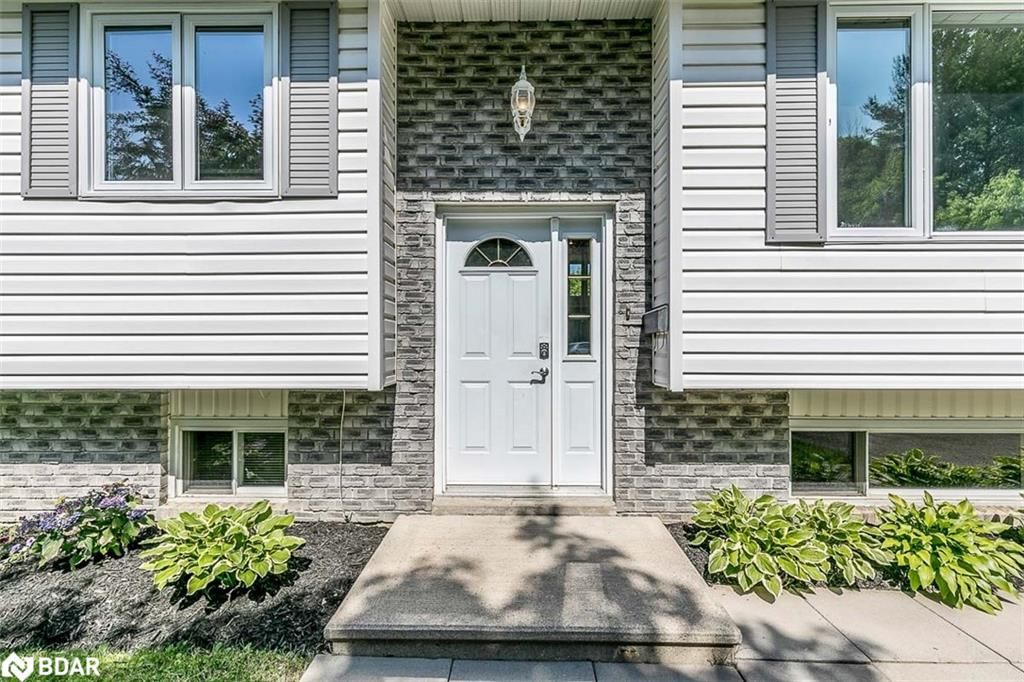
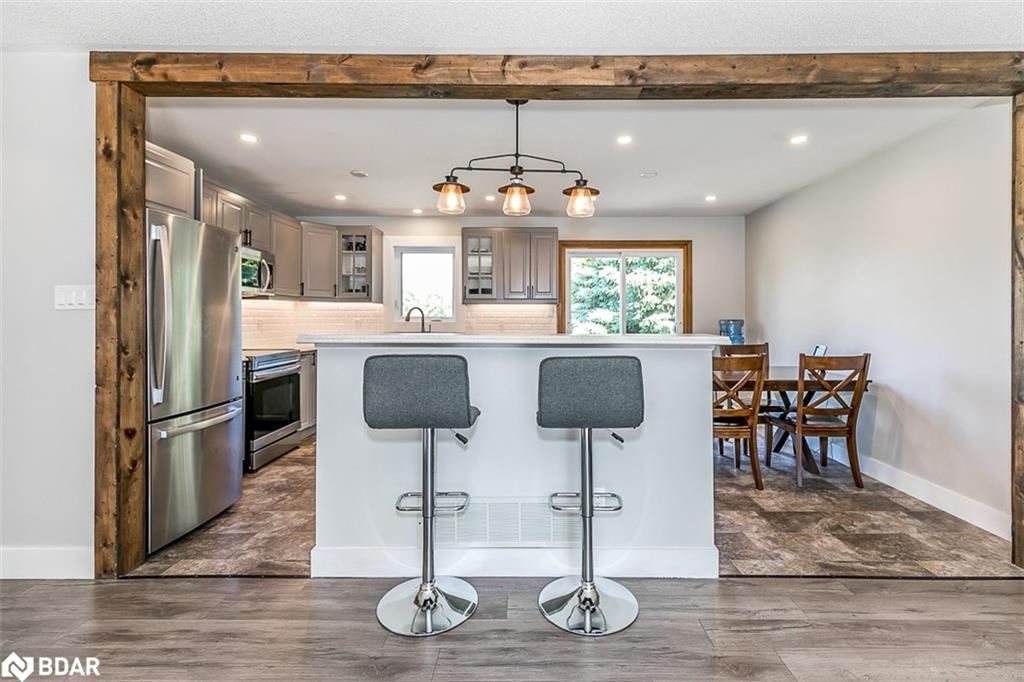
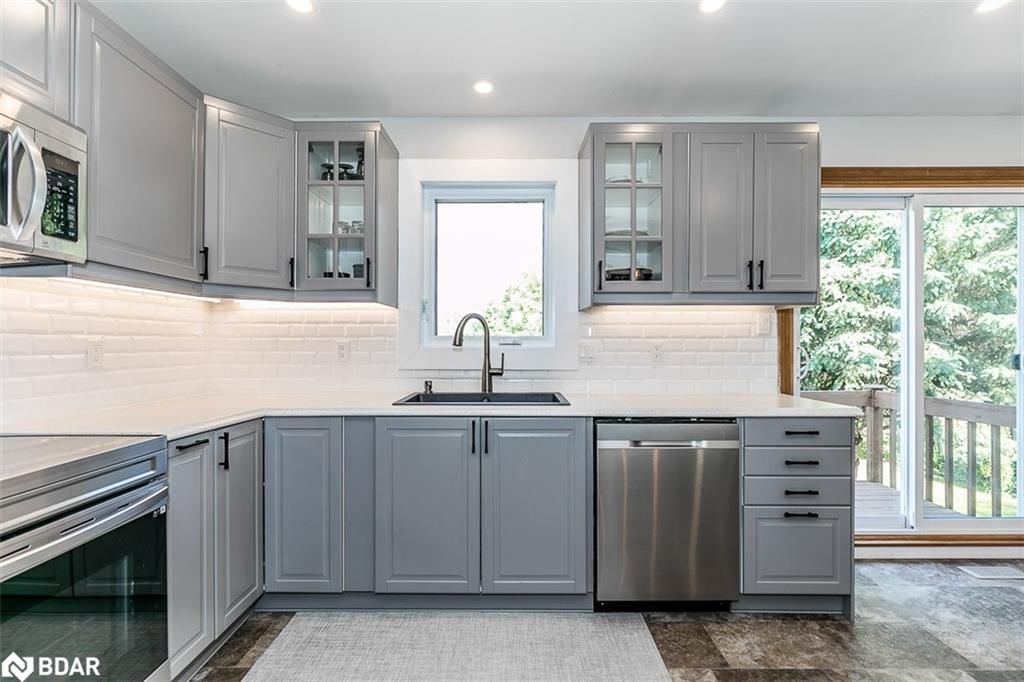
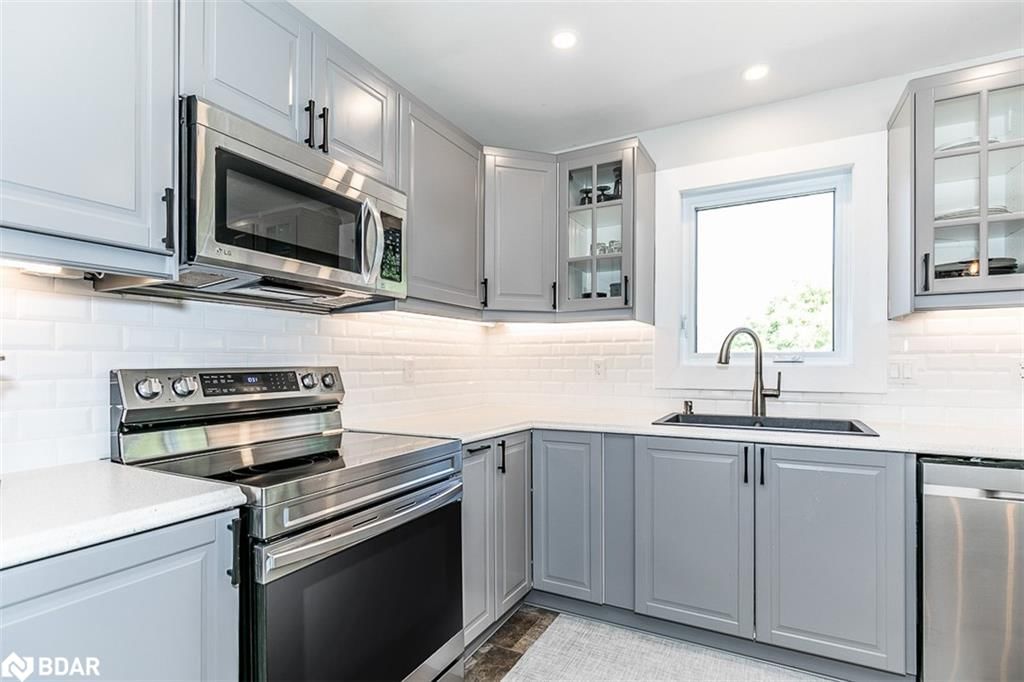
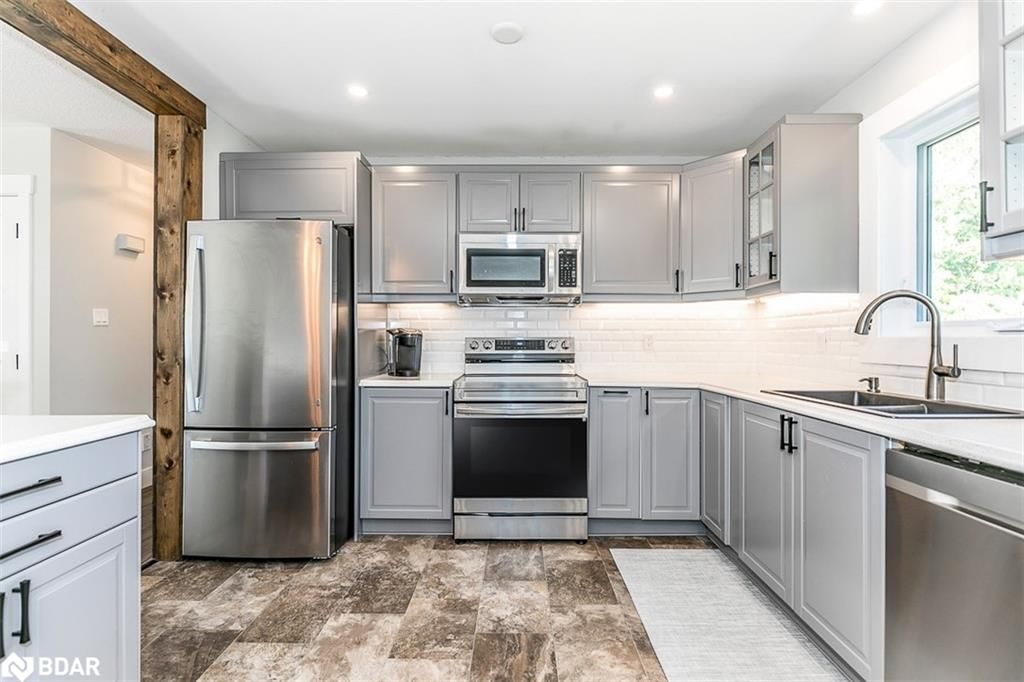
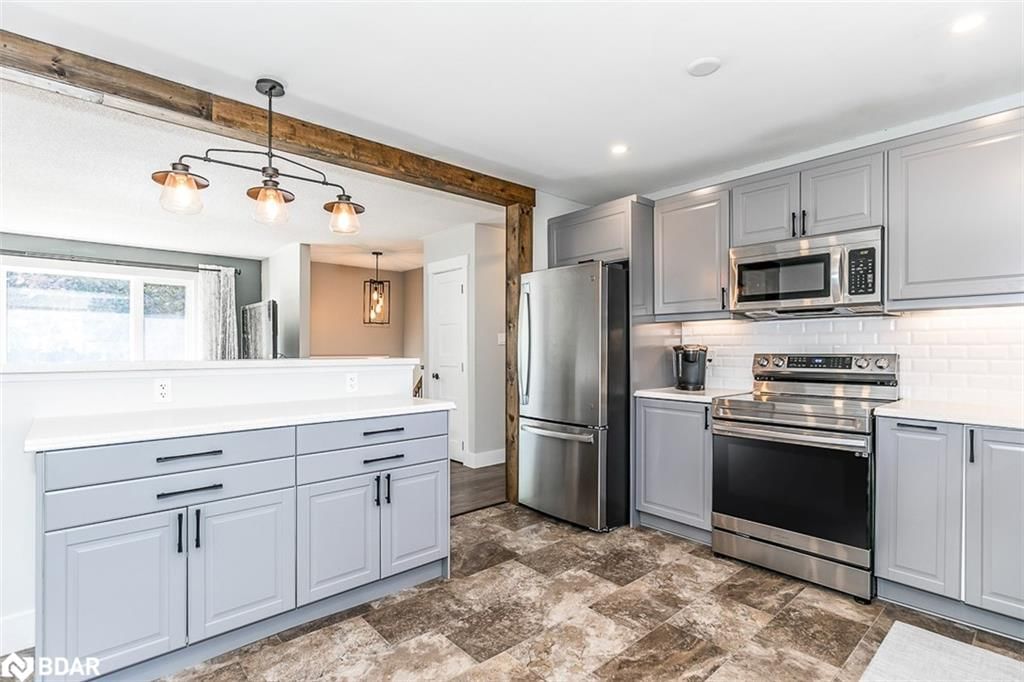
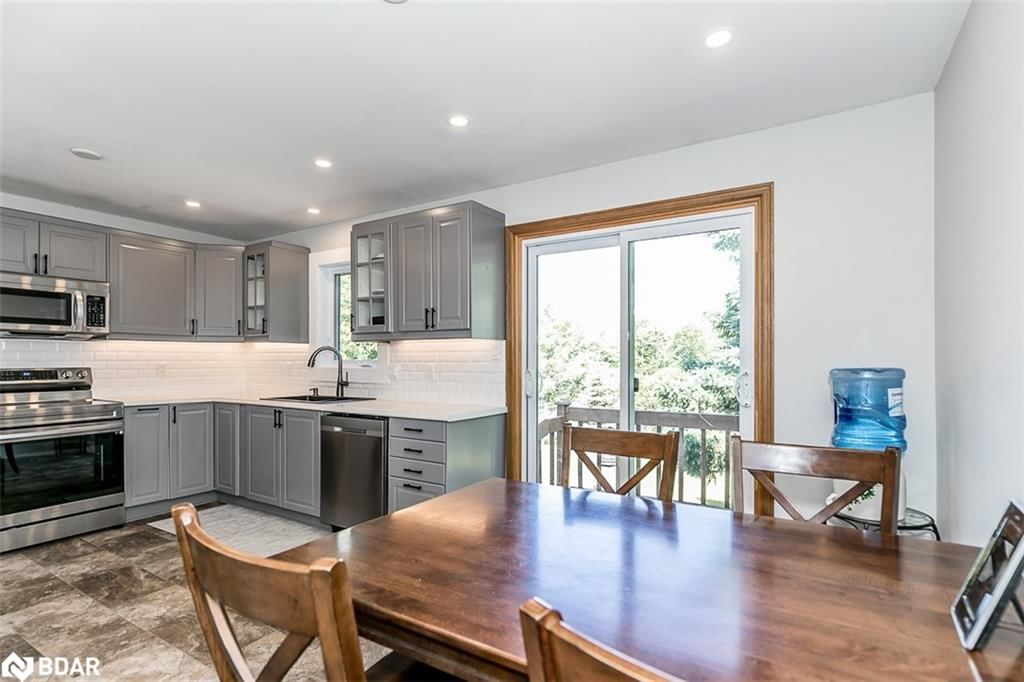
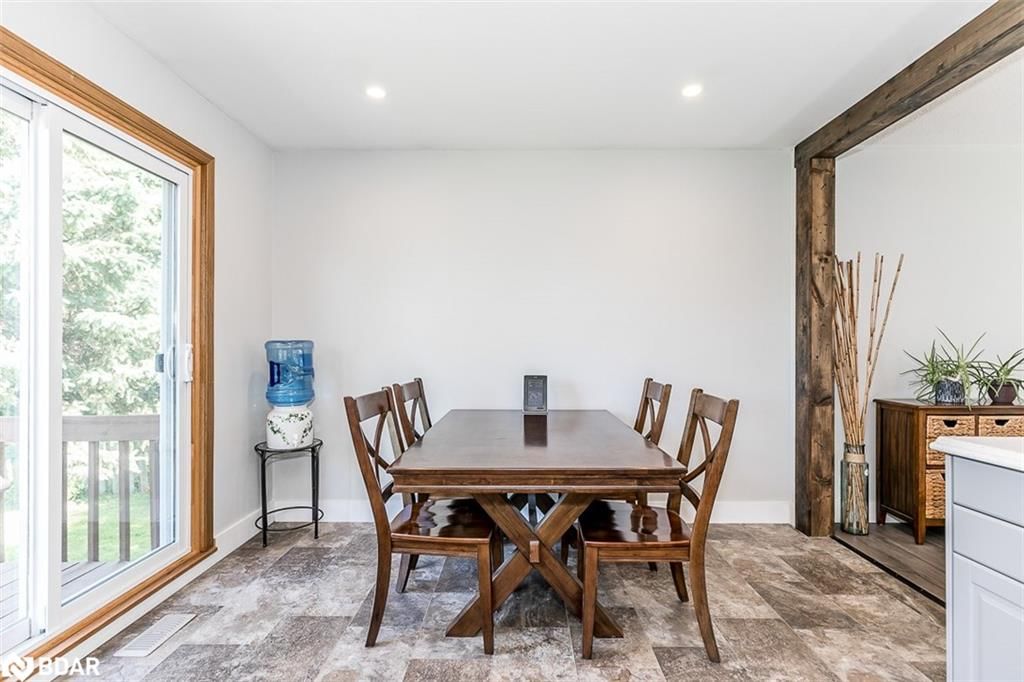
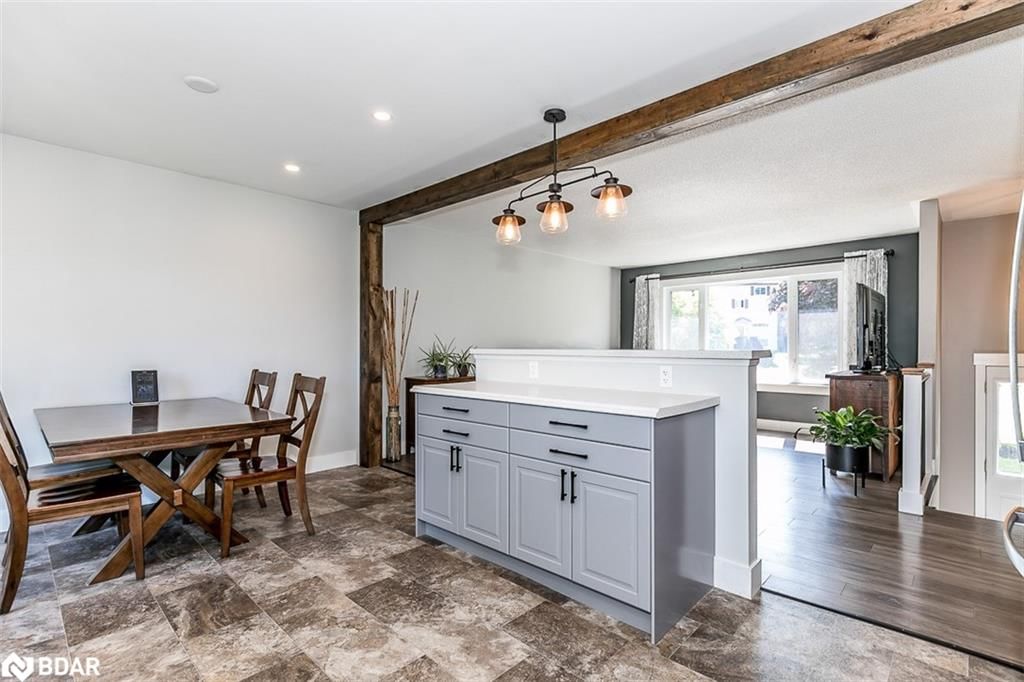
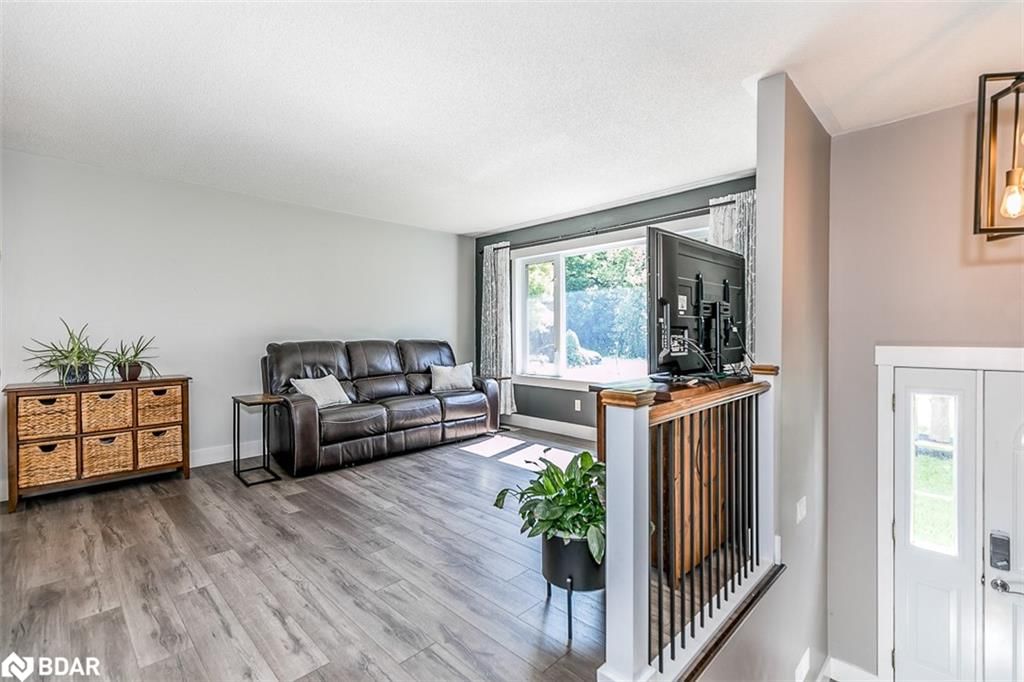
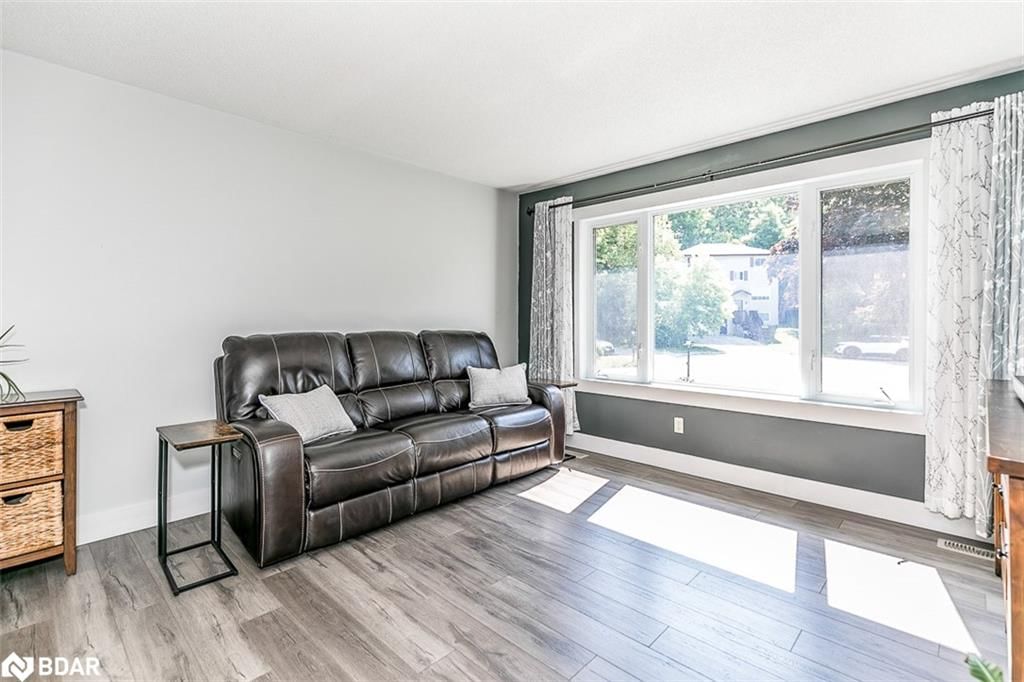
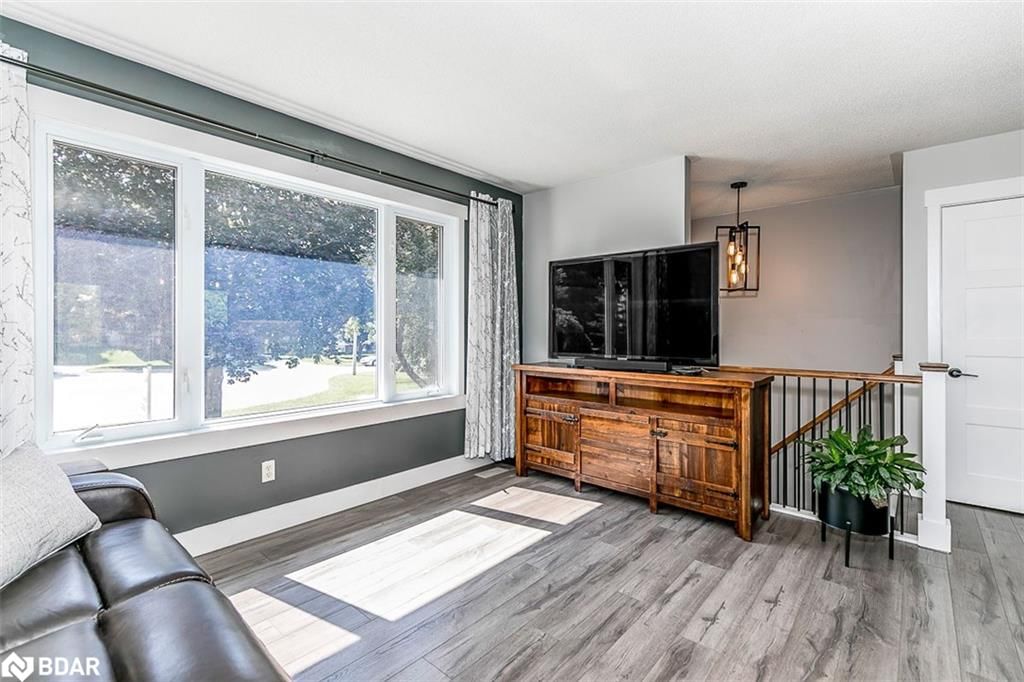
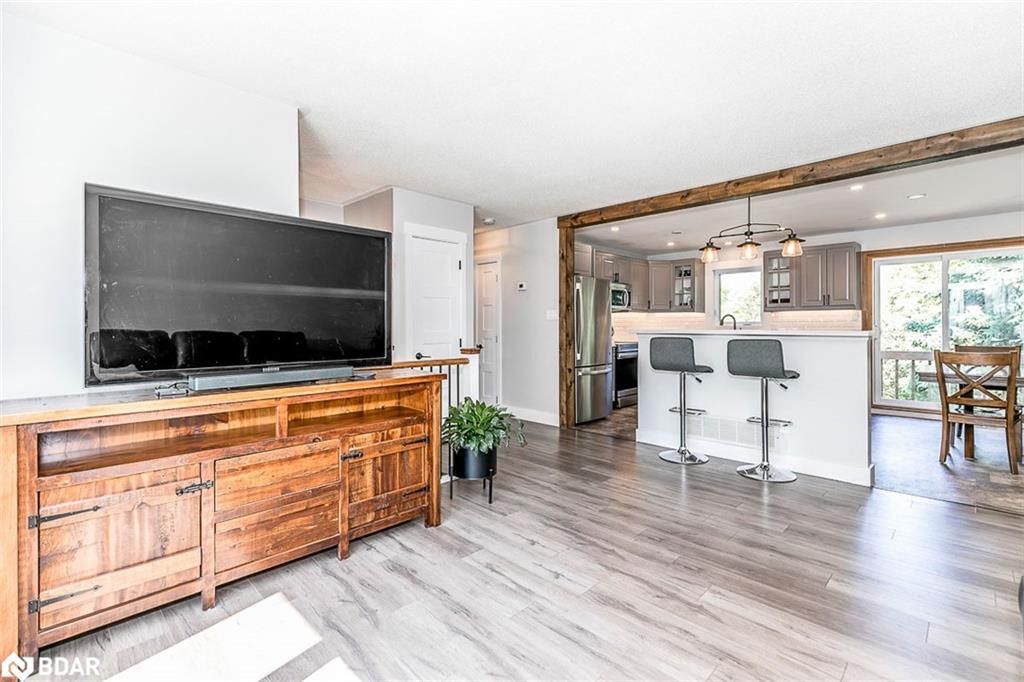
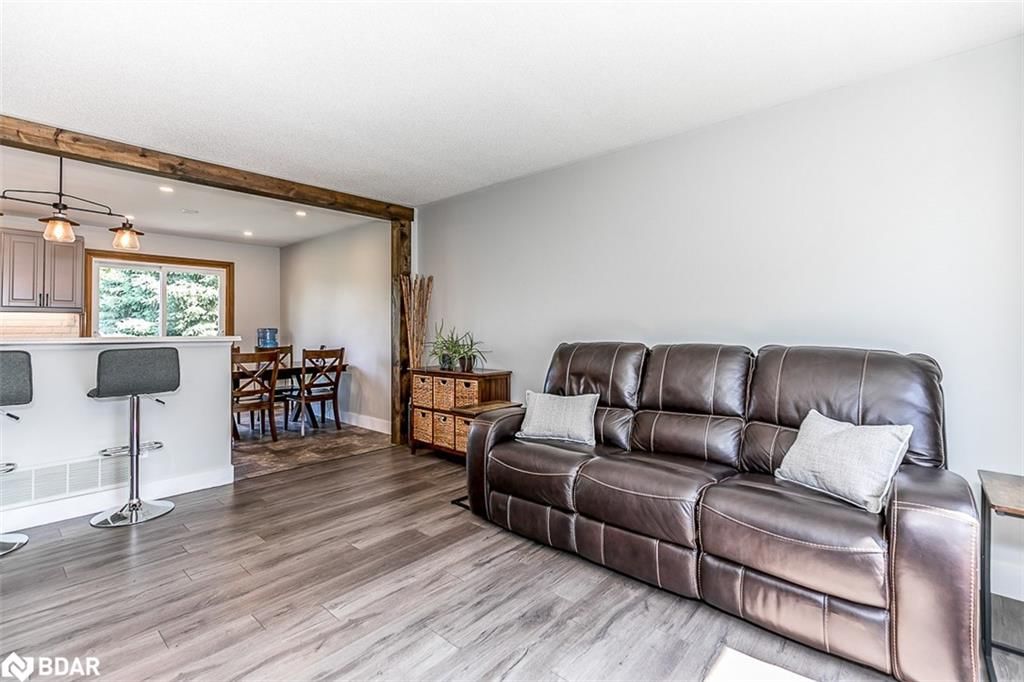
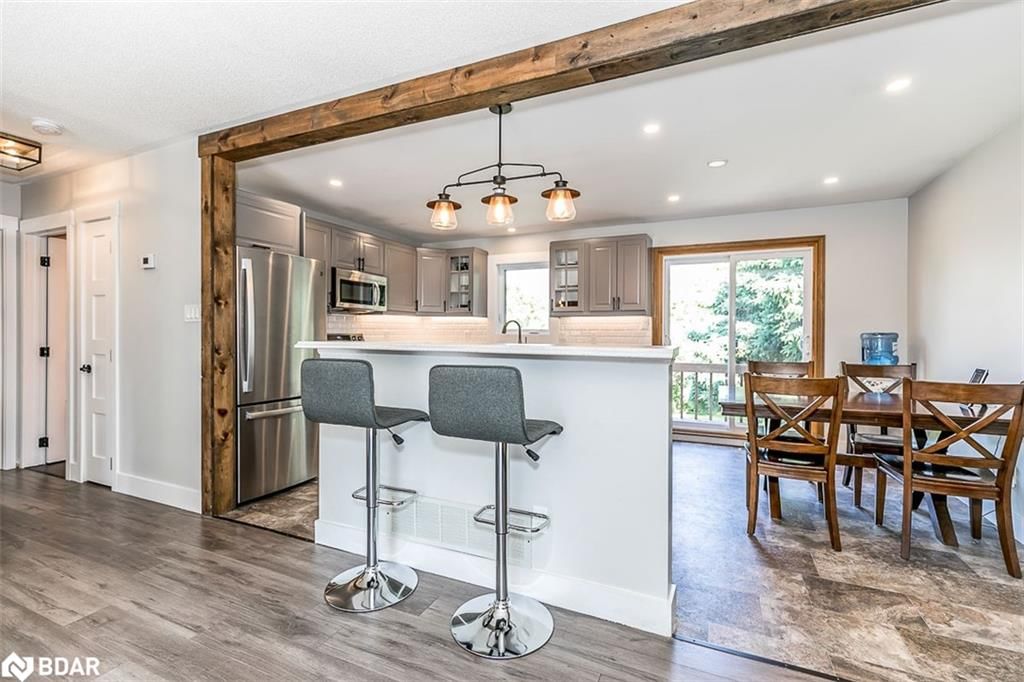
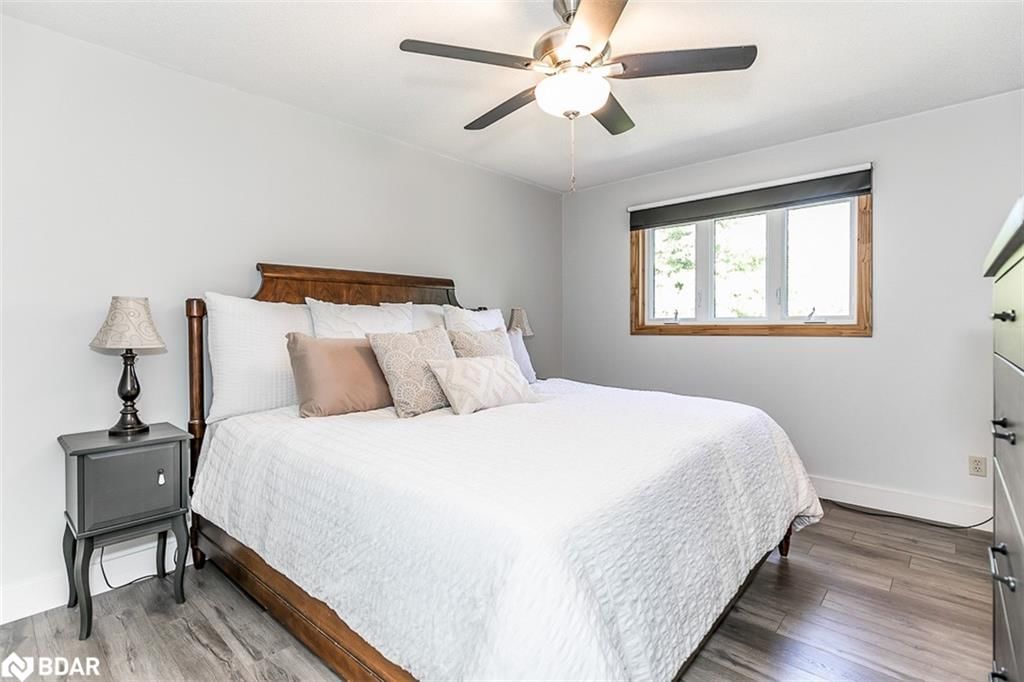
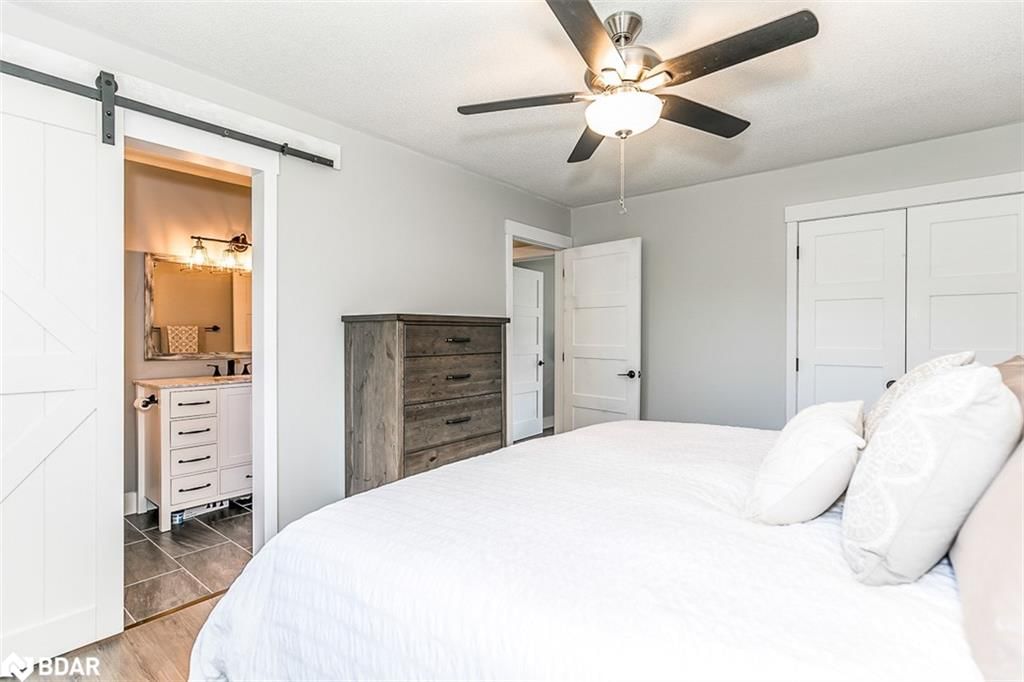
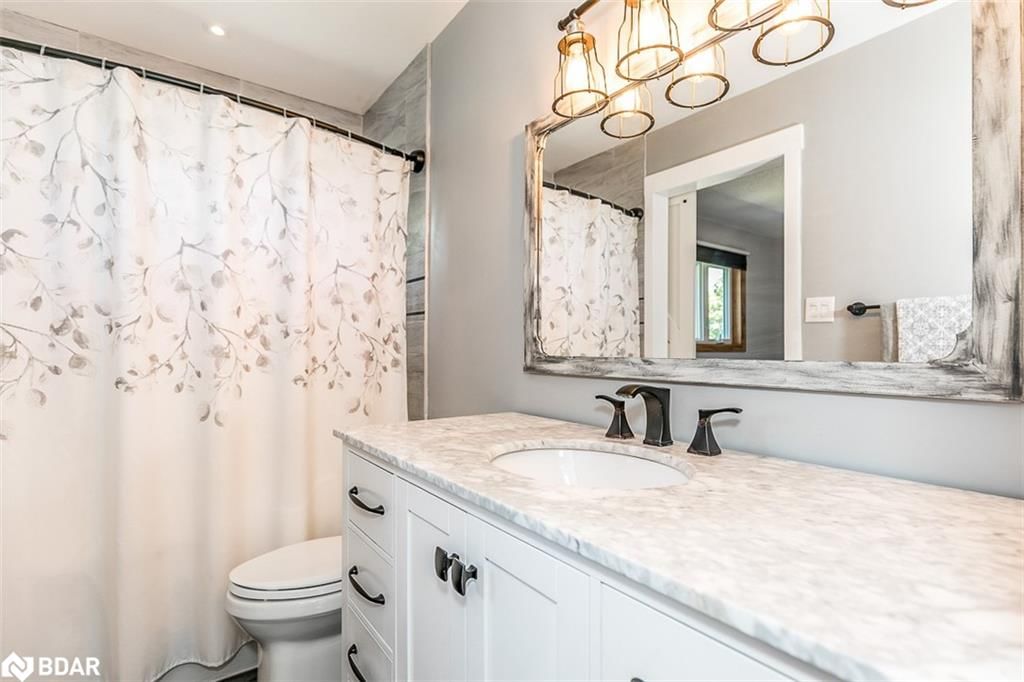
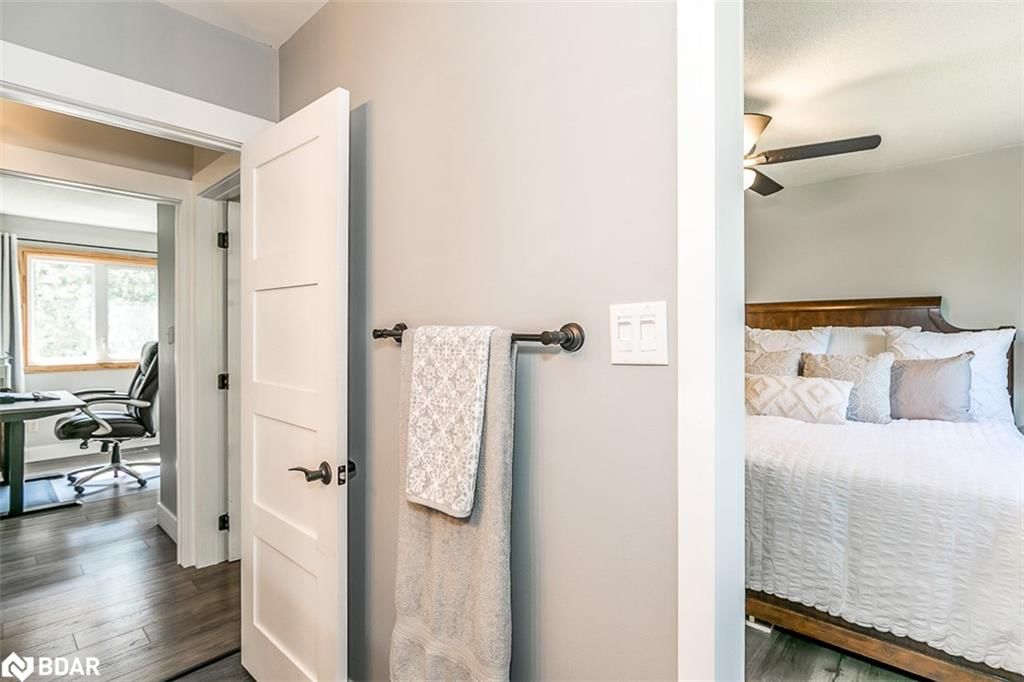
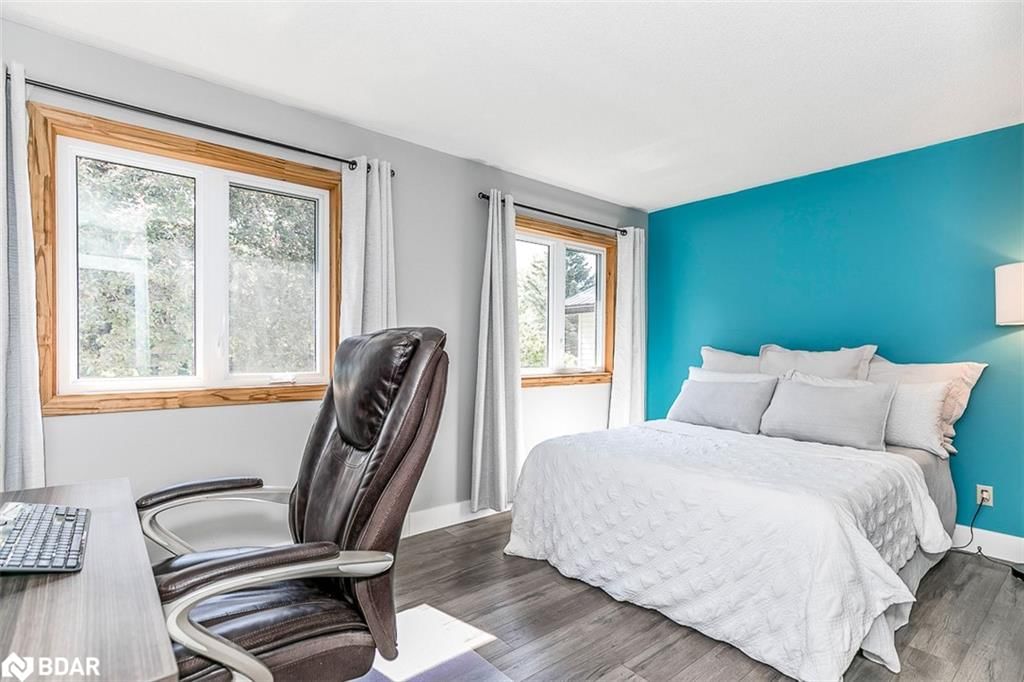
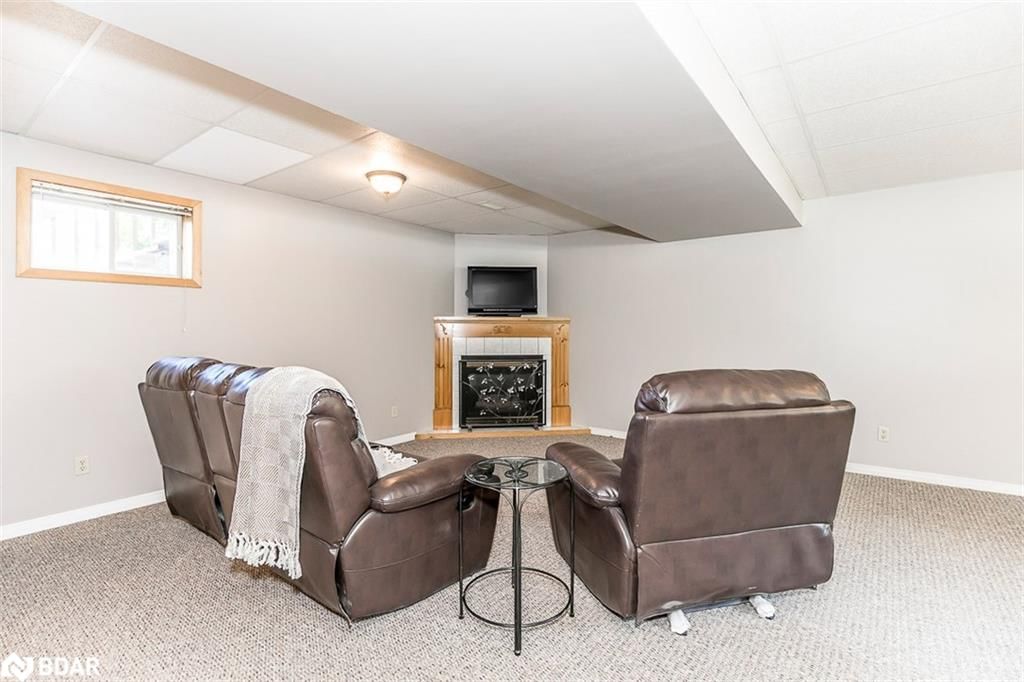
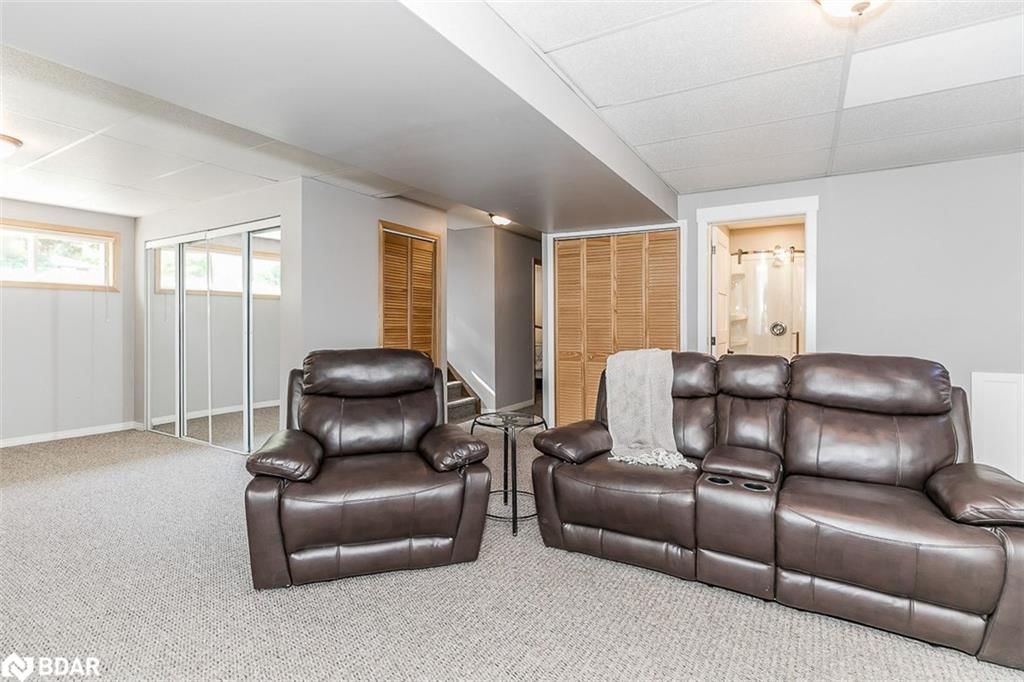
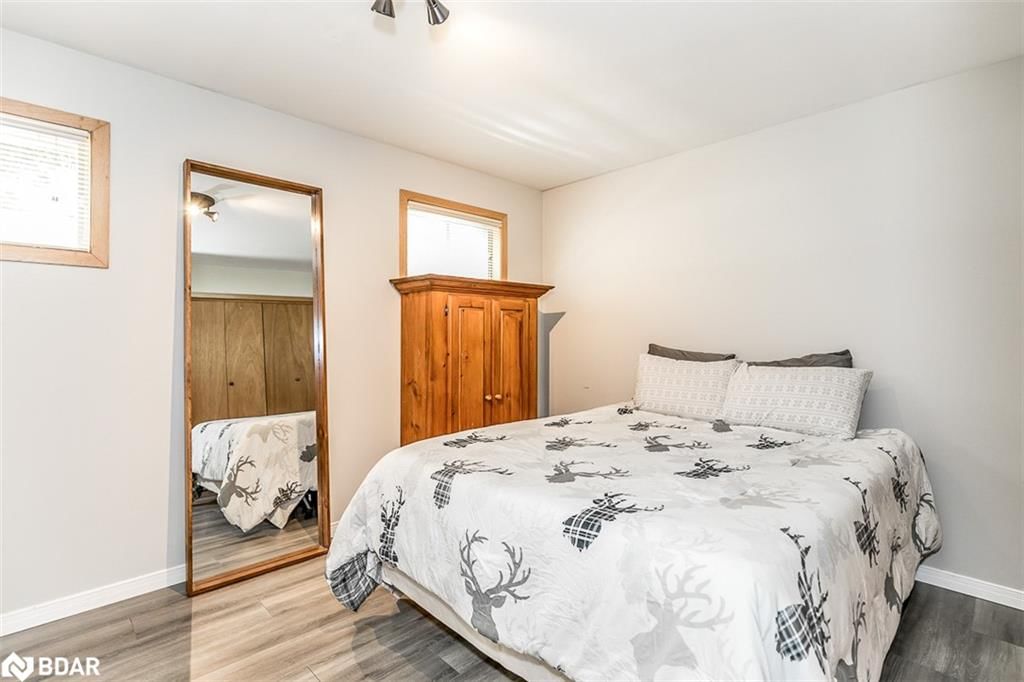
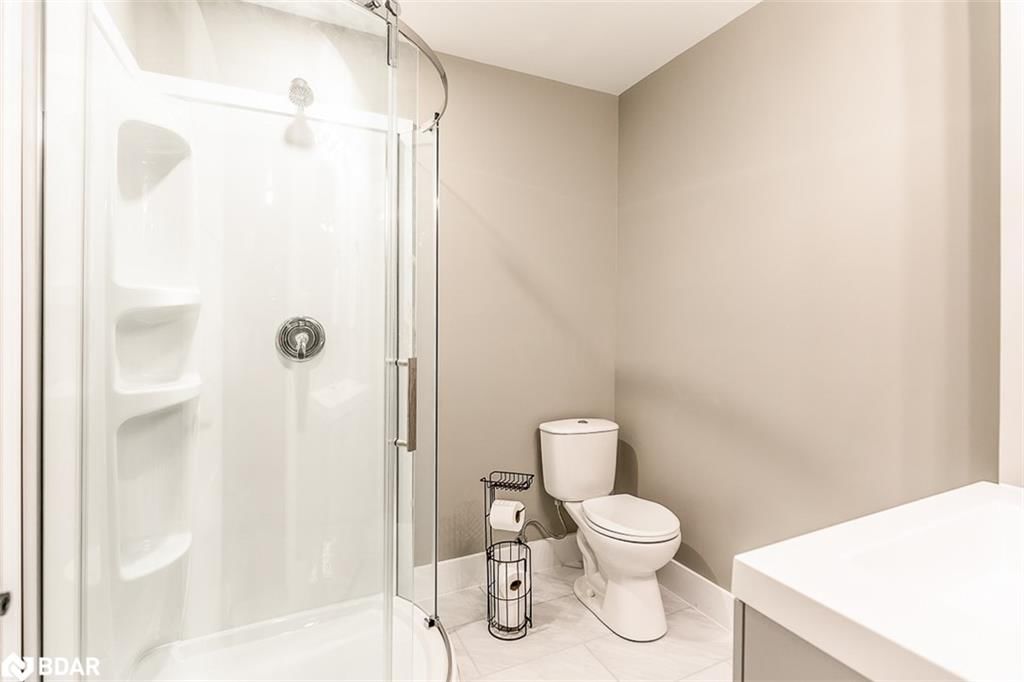
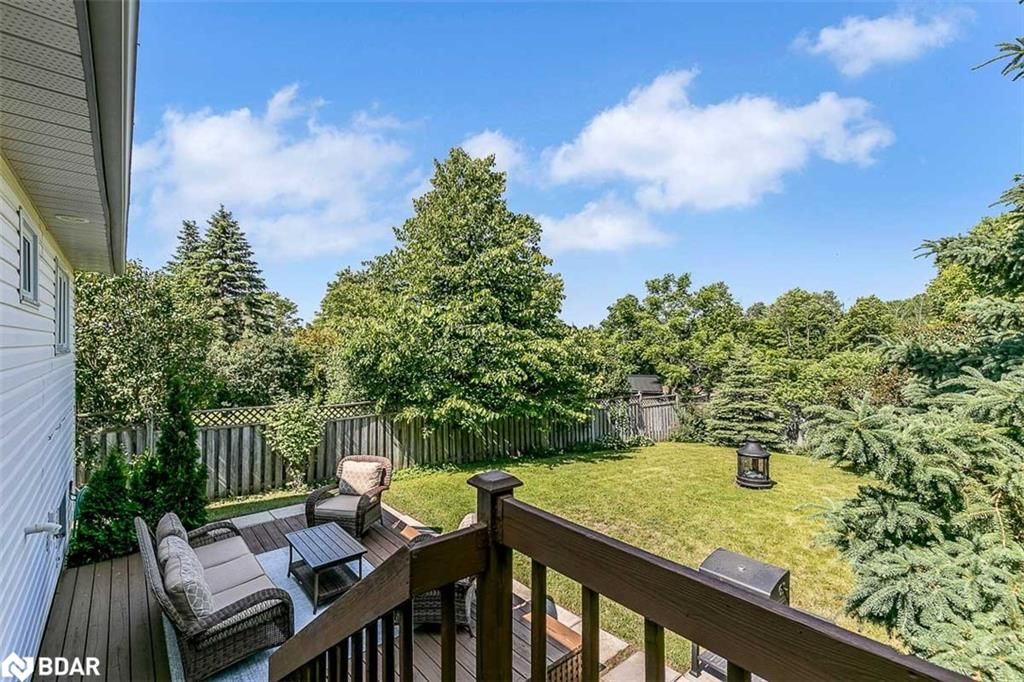
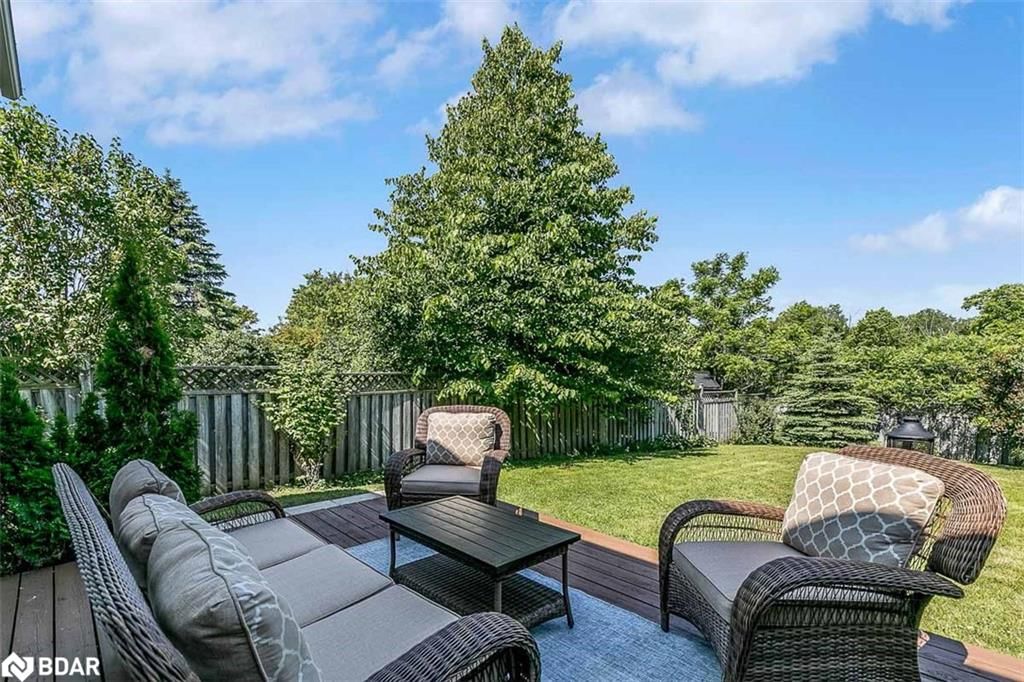
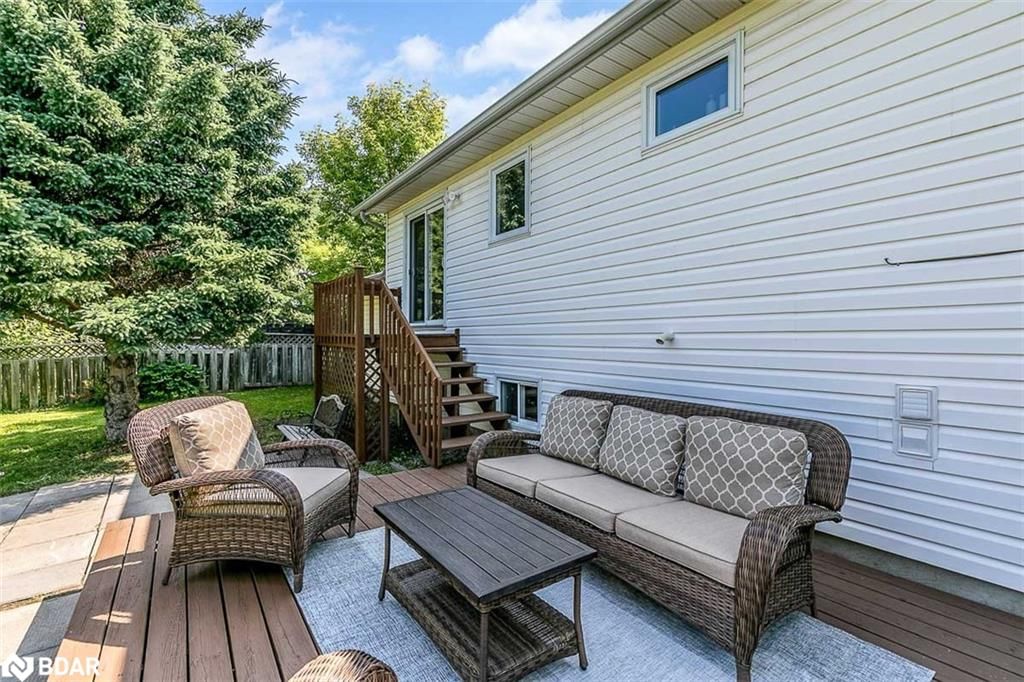
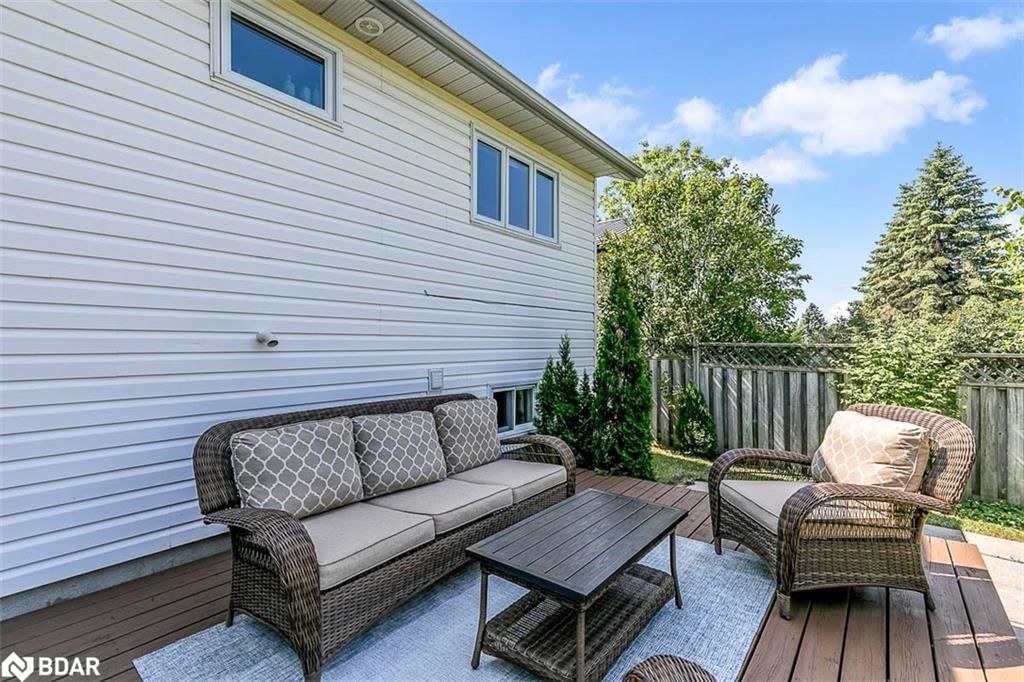
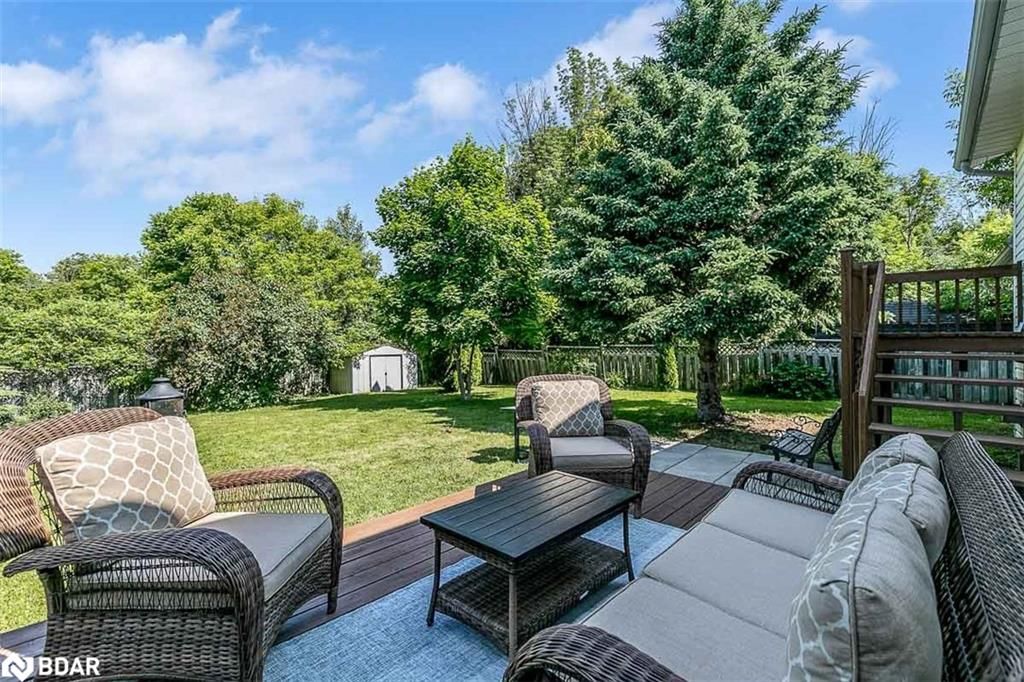
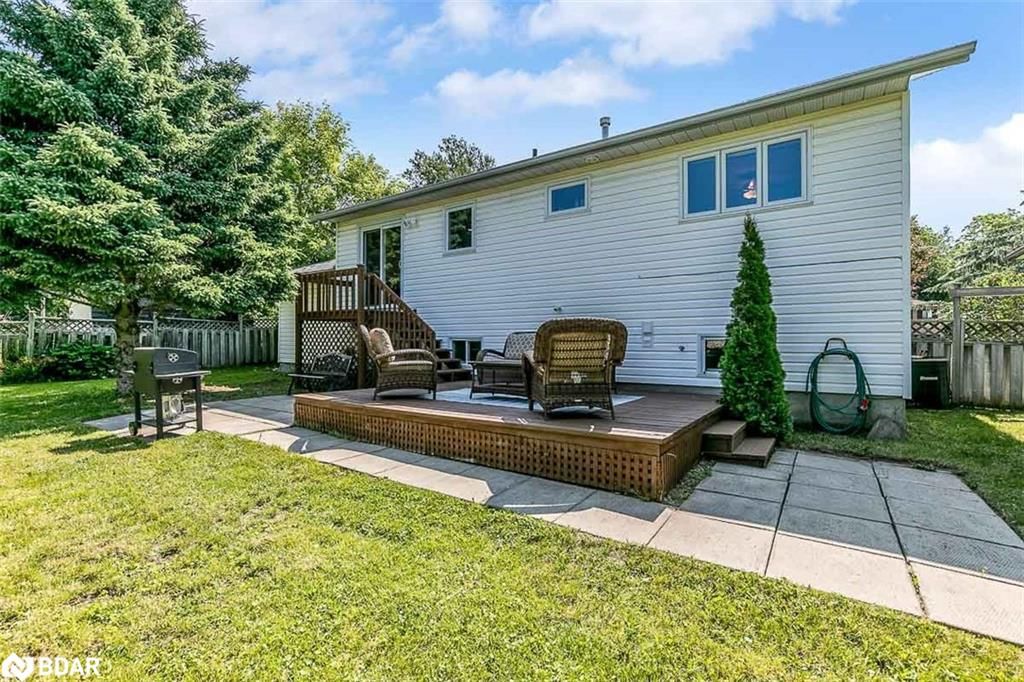
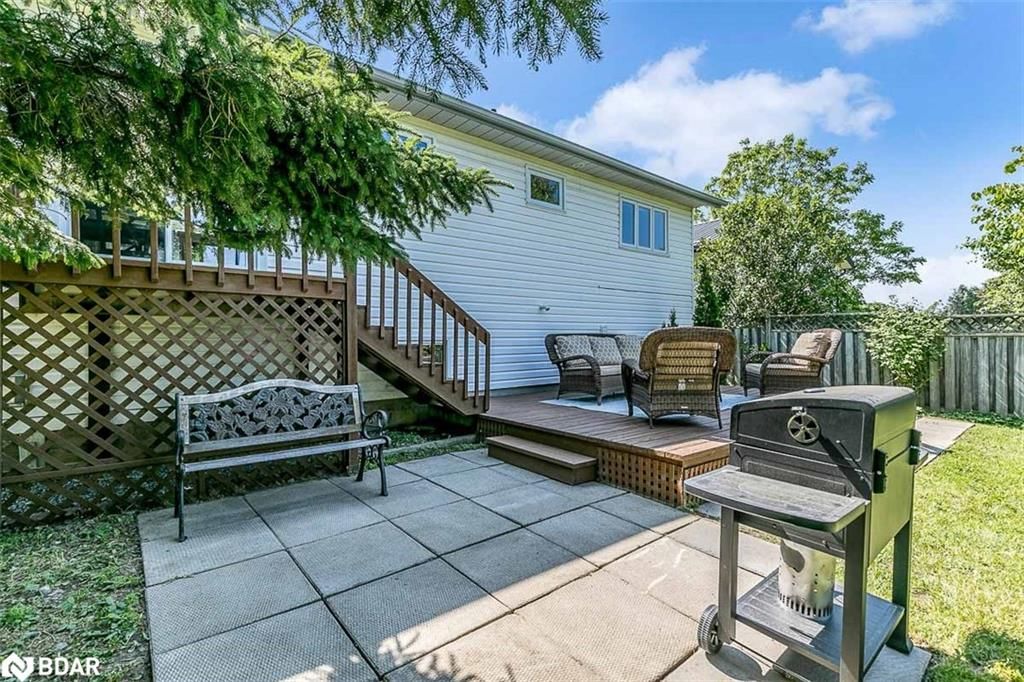
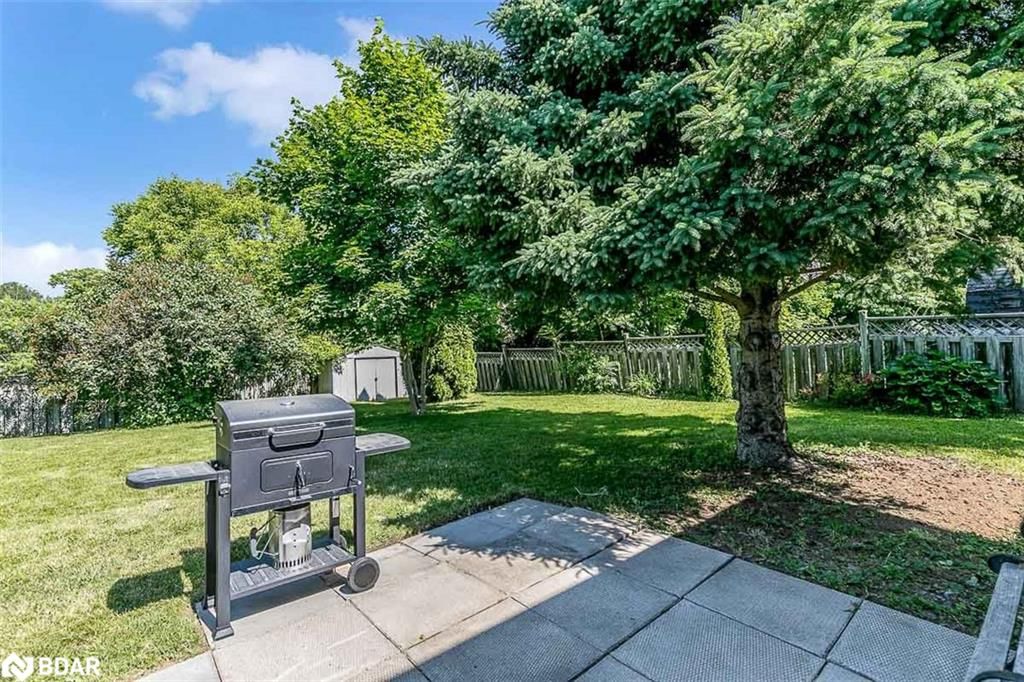
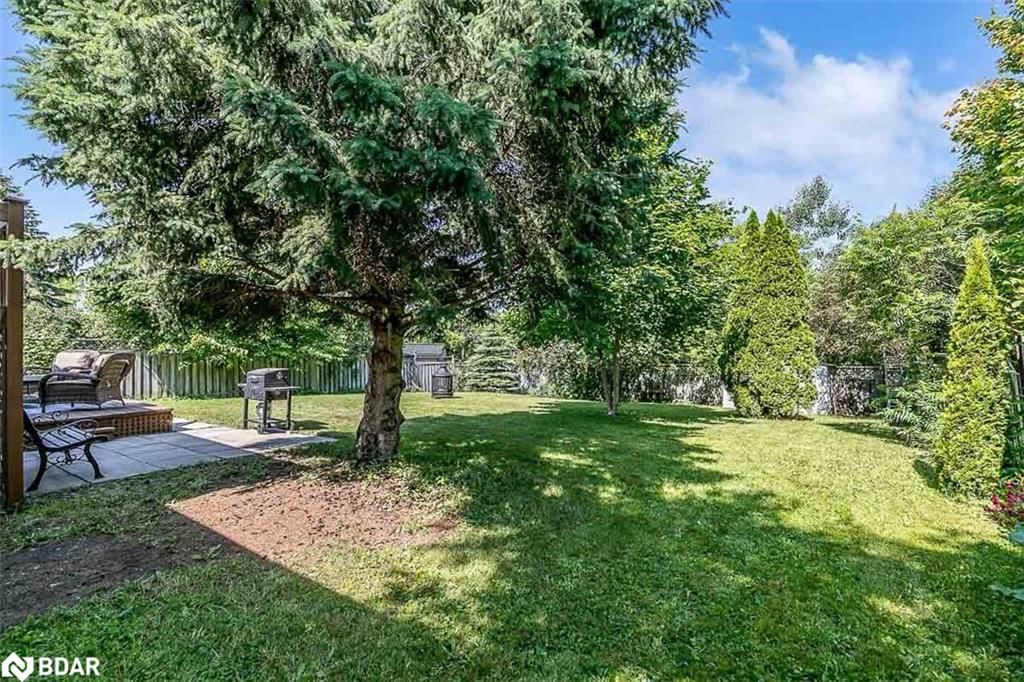
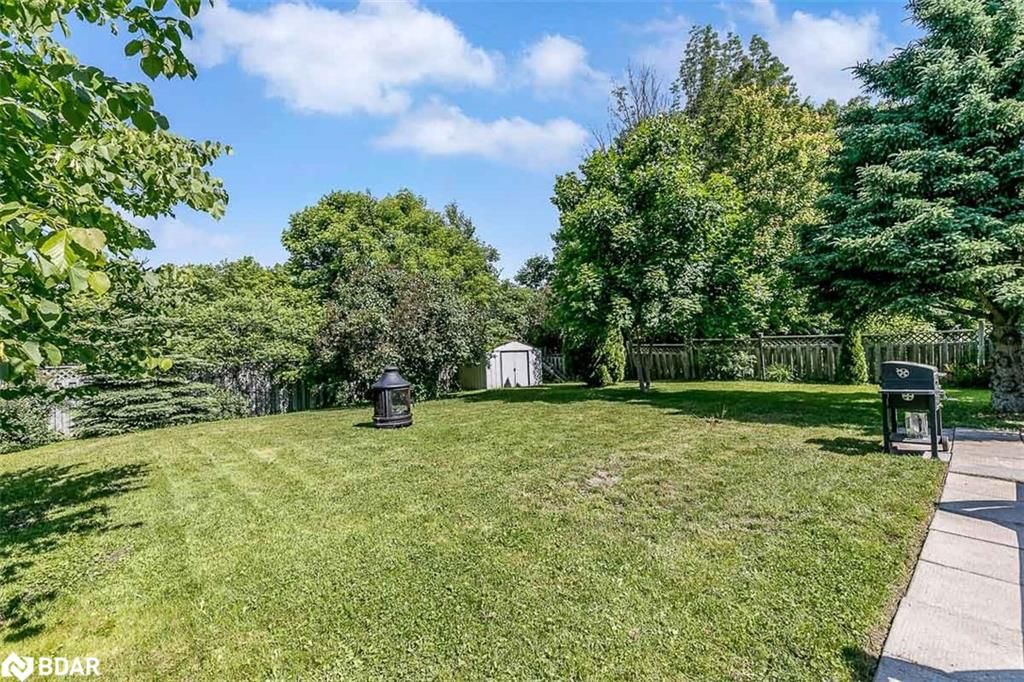
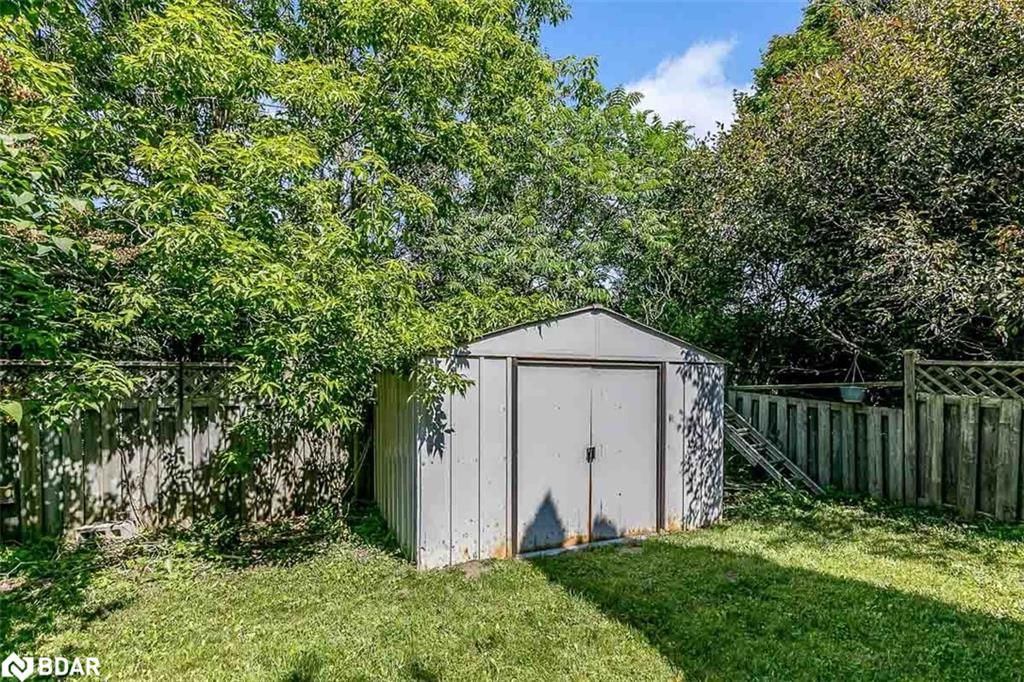
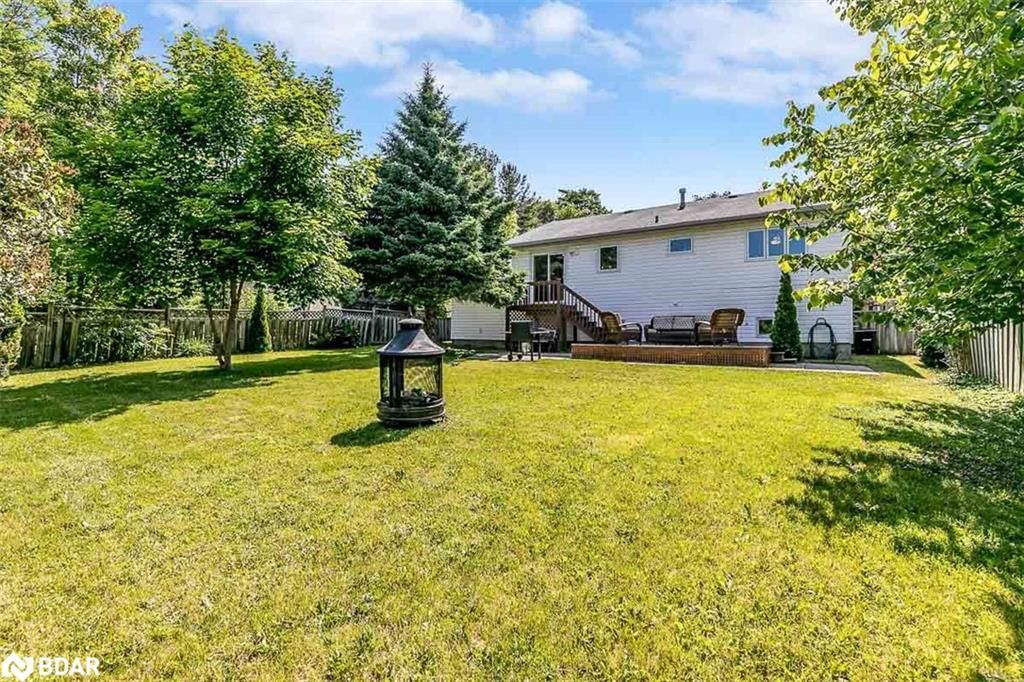
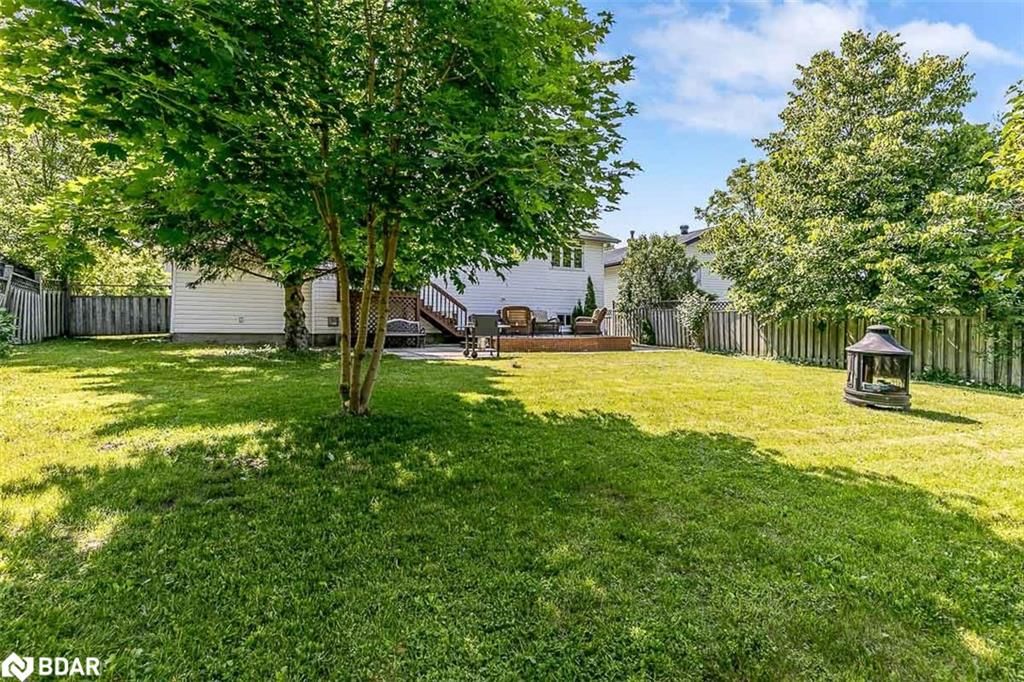
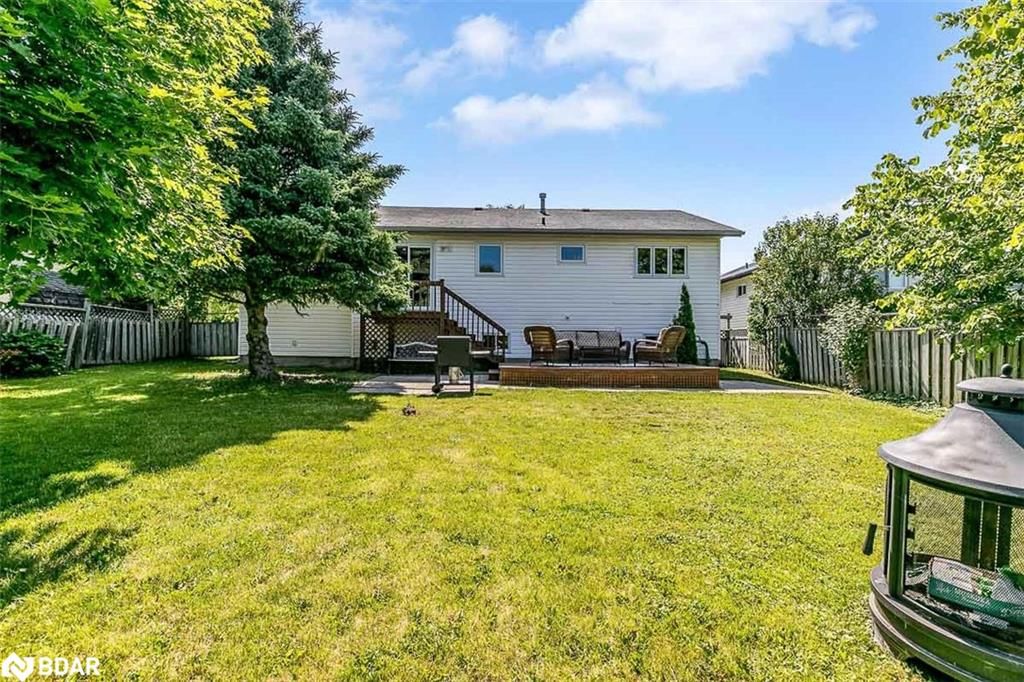
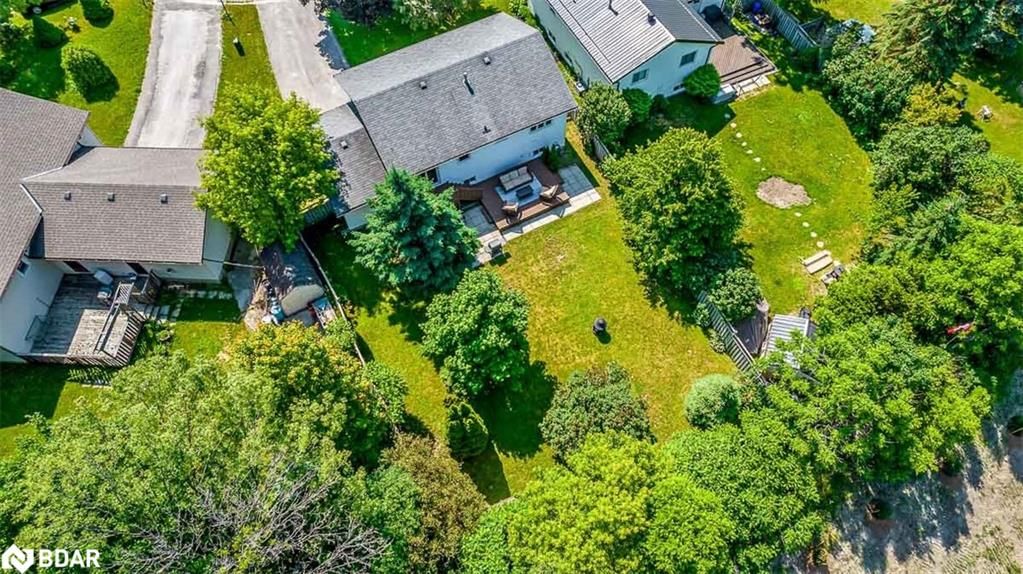
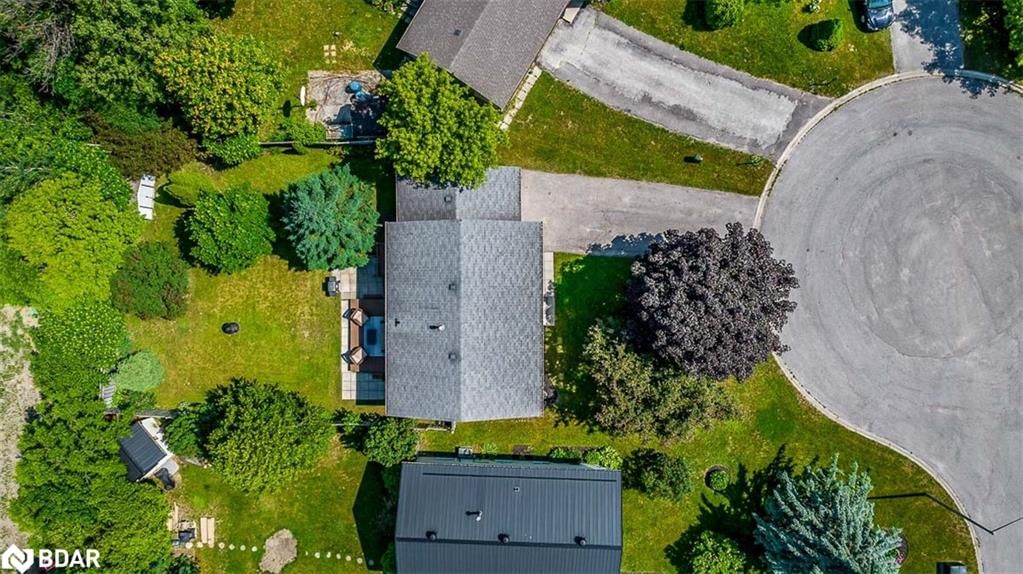
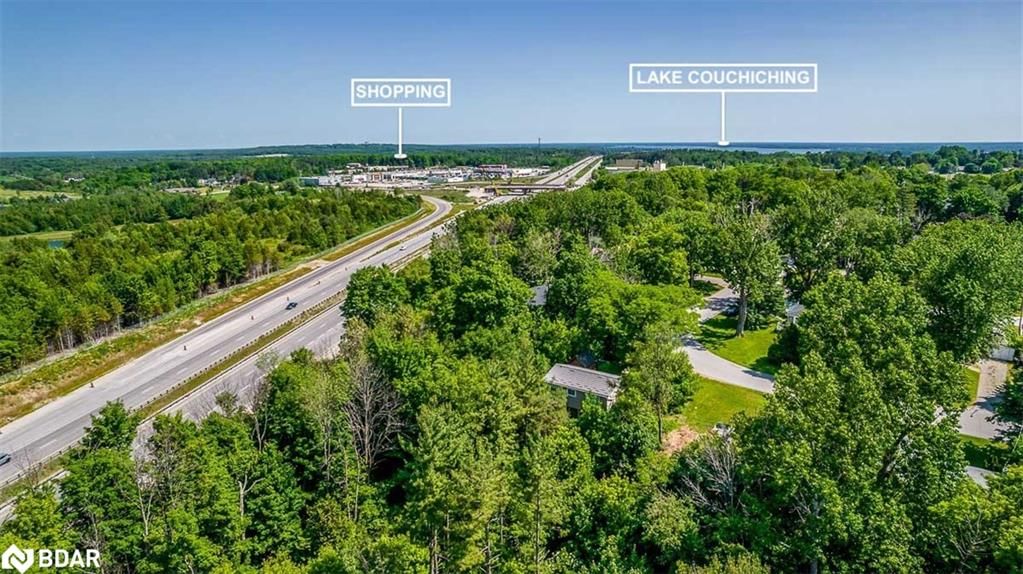
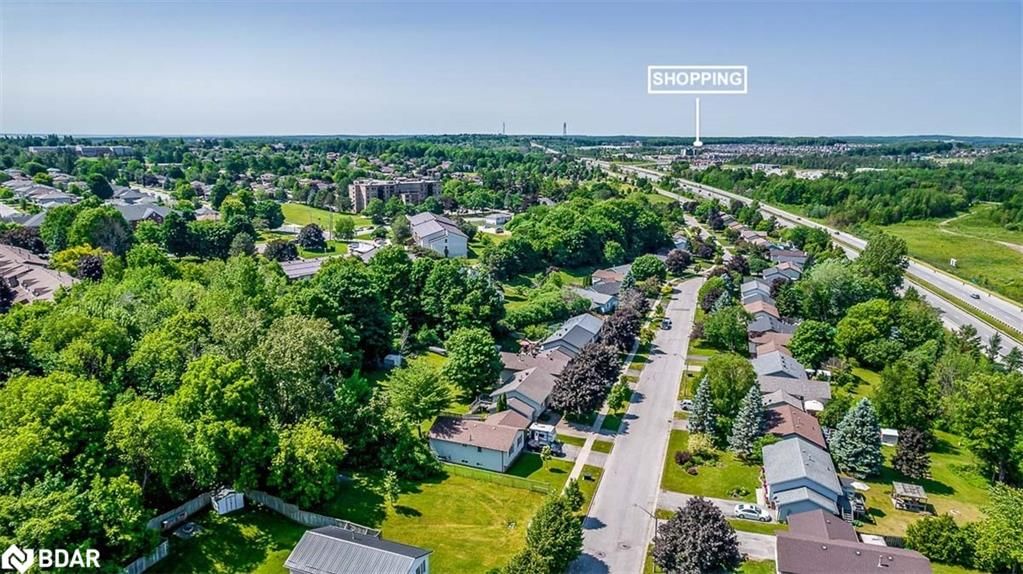
Welcome to 64 Dancy Drive! This charming raised bungalow, located in the highly sought-after northward of Orillia, offers a perfect blend of modern updates, spaciousness, and an ideal location. An abundance of natural light floods the main floor, creating a bright and inviting atmosphere. The heart of the home lies in the stunning updated eat-in kitchen, which features a walkout to the deck, allowing for easy extension of gatherings outdoors. The deck overlooks a large fully fenced backyard, providing a secure and private place for children to play or for hosting memorable BBQs with friends and family. Additionally, the main level boasts 2 generously sized bedrooms, with the primary bedroom offering a beautifully updated semi-ensuite bath featuring modern fixtures and finishes. Downstairs, you'll find a spacious and inviting rec. room with a cozy gas fireplace, a large 3rd bedroom, another updated 3pc bath, and a laundry area. All of this is situated at the end of a quiet cul-de-sac where neighbours take great pride in their yards. The property is conveniently close to shopping, parks, and Hwy 11 for easy commuting. Don't miss the opportunity to make this bright and spacious home your own. Contact us today for a private showing and experience the charm and convenience that this property has to offer.Peace of mind with new shingles (June 2023) and newer kitchen appliances (July 2022).
Built-in Microwave,Dishwasher,Dryer,Refrigerator,Stove,Washer,Window Coverings
Copyright 2025 Information Technology Systems Ontario, Inc. The information provided herein must only be used by consumers that have a bona fide interest in the purchase, sale, or lease of real estate and may not be used for any commercial purpose or any other purpose.
Eat-in Kitchen
Living Room
Bedroom Primary
Bedroom
Recreation Room
Bathroom
Laundry
Bedroom
Bathroom
The graph below compares the average list price and average sale price of homes in this neighborhood by month for the last 24 months. When average sale price is greater than average list price, this may suggest a buyer's market. When average sale price is lower than the average list price this may suggest a seller's market.
The graph below illustrates the average days on market for homes in this neighborhood. The yellow area may indicate a buyer's market, the green area may indicate a balanced market and the red area may indicate a seller's market.
Sales Representative, Century 21 People’s Choice Realty Inc., Brokerage
(647) 576 - 2100